Windows Leaks Detector- Memory Leak Detection
Introduction
Memory leaks are a silent enemy of software performance. They occur when a program allocates memory but fails to release it when no longer needed, gradually consuming system resources and causing applications to slow down or crash. For developers and system administrators, identifying and fixing these leaks is crucial for maintaining stable, high-performance applications.
Windows Leaks Detector emerged as a specialized tool designed to address this challenge. While relatively lightweight and straightforward, it offers developers a practical solution for detecting resource leaks in Windows applications without requiring source code modifications. This article explores the functionality of this tool and places it in the broader context of memory leak detection strategies for Windows systems.
Understanding Memory Leaks in Windows Applications
What Exactly Is a Memory Leak?
A memory leak occurs when a program allocates memory from the operating system but never returns it, even after the memory is no longer needed. Over time, these unfreed allocations accumulate, reducing available memory and potentially causing performance degradation, system instability, or application crashes.
Traditional definitions focus on memory that remains allocated until program termination. However, for long-running applications like servers or services, a more practical definition emerges: the gradual increase in memory consumption over time.
Different Types of Memory Leaks
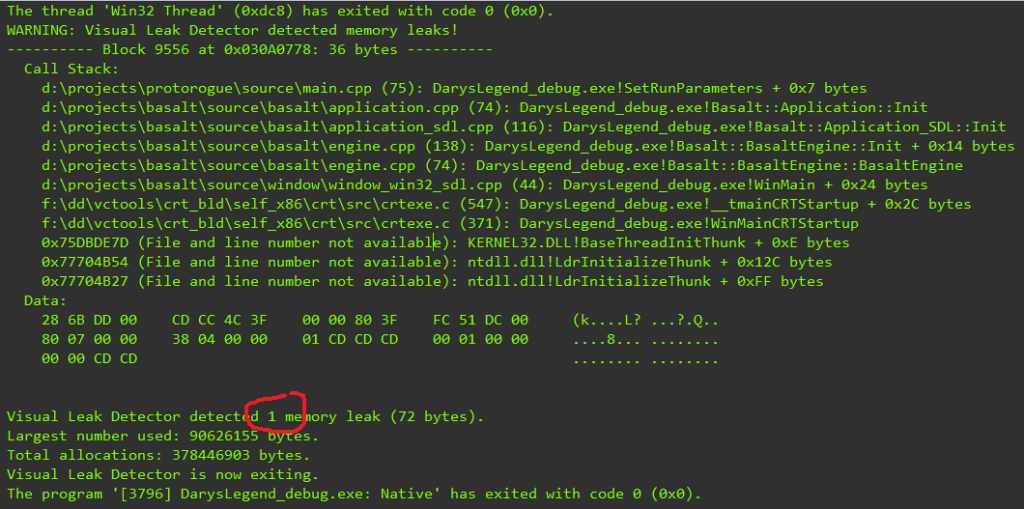
Not all memory leaks are created equal. One-time leaks occur when a program allocates memory during initialization and fails to release it. While not ideal, these typically consume a fixed amount of memory and don’t worsen over time.
Cyclic memory leaks present a more serious problem. These occur when a program leaks memory during each operational cycle—such as processing a request or opening a document. Even small leaks of a few kilobytes per cycle can eventually exhaust system memory in long-running applications.
This distinction is important because cyclic leaks follow an O(n) growth pattern, while one-time leaks remain O(1) and are generally less harmful. Tools like Windows Leaks Detector are specifically designed to identify these more dangerous cyclic patterns.
What Is Windows Leaks Detector?
Windows Leaks Detector is a software utility designed to detect memory and resource leaks in any Windows application. Created as an open-source project under the GNU General Public License version 2.0, it employs a unique approach to leak detection that sets it apart from many commercial alternatives.
Key Features
The tool operates through API hooking, intercepting calls to Windows memory management functions. It requires no source code access and can attach to any running Windows process, making it valuable for analyzing third-party applications or legacy code.
The core functionality includes:
- Process Attachment: You can attach the detector to any running Windows application without modifications.
- Call Stack Capture: Each memory allocation is tracked with its complete call stack, helping identify exactly which code path created the leak.
- Leak Aggregation: All leaks are grouped by their call stack origin, making it easier to identify and fix common sources.
- Time-Based Monitoring: You can start and stop monitoring at specific points to isolate memory allocations within particular operations.
Limitations of the Tool
Like any software tool, Windows Leaks Detector has certain constraints. The initial version primarily monitors HeapAlloc, HeapRealloc, and HeapFree functions, but doesn’t track all memory-related operations. For instance, applications that dynamically create and release heaps using functions like HeapCreate may not be fully monitored.
Additionally, the tool cannot monitor multiple processes simultaneously due to limitations in its inter-process communication mechanism. This means you need to analyze applications individually rather than monitoring an entire system at once.
The Windows Leaks Detector also has specific system requirements, originally designed for Windows XP and later versions. User feedback has been mixed, with some reviewers noting difficulty using the tool effectively or encountering issues with attachment on certain systems.
How Windows Leaks Detector Works
The Approach: Cyclic Pattern Detection
What sets Windows Leaks Detector apart is its approach to identifying leaks in “cyclic” patterns. Many applications follow a cycle of operations: opening a document, processing a request, or handling a transaction. After each cycle, the application should return to its initial state, with all temporary memory released.
The tool allows you to:
- Run your application and perform one full cycle to ensure proper initialization
- Start memory monitoring
- Execute another cycle of operations
- Stop monitoring
- Execute a cleanup cycle
- Report all memory allocations that weren’t released
This approach helps distinguish between legitimate one-time allocations and problematic cyclic leaks.
Technical Foundation
Windows Leaks Detector works by hooking Windows API calls. When a monitored function is called, the tool intercepts it, records the allocation details and call stack, and then passes the call through to the original Windows function. When memory is released, the tool removes it from its tracking list.
This hooking mechanism is powerful because it works at the system level rather than requiring modifications to application code. It can detect leaks regardless of the programming language used, making it valuable for mixed-language environments.
Alternatives and Modern Solutions
Since Windows Leaks Detector’s last major update, memory leak detection tools have evolved considerably. Here are some alternative approaches and modern tools:
Microsoft’s UMDH (User-Mode Dump Heap)
Part of the Debugging Tools for Windows package, UMDH provides heap analysis capabilities. It tracks heap allocations across different points in time and can generate reports showing memory growth. As a command-line tool, it’s particularly useful for automated testing environments.
Deleaker
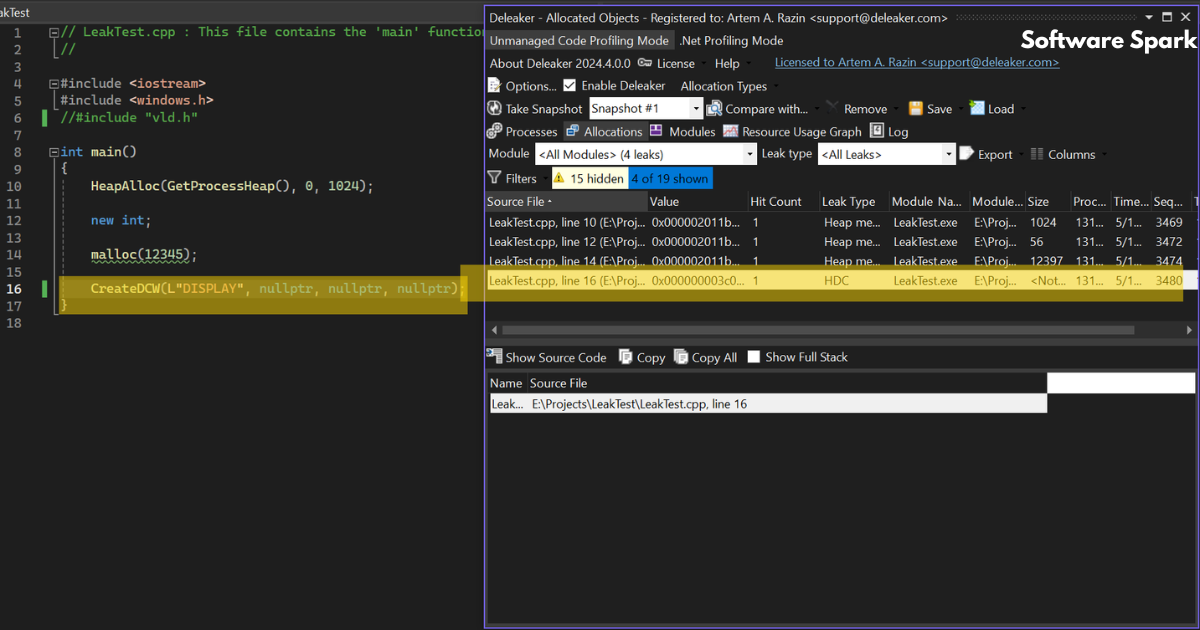
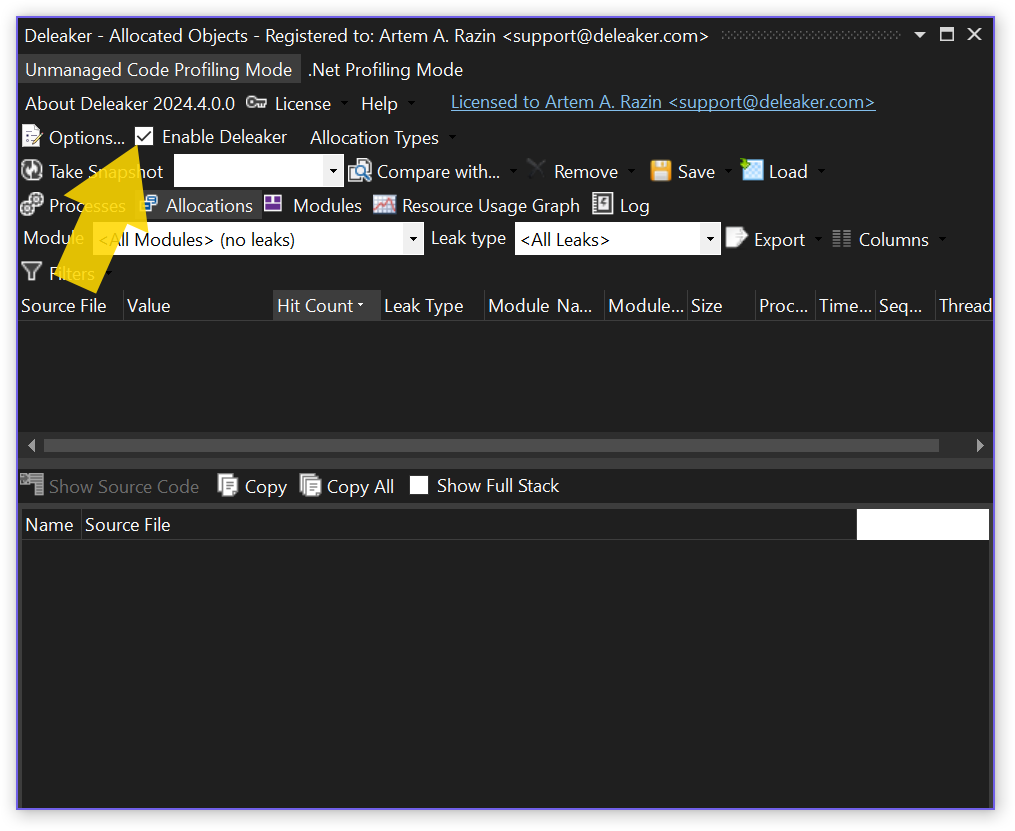
A more modern commercial solution, Deleaker offers comprehensive memory leak detection with Visual Studio integration. It supports detection of memory, GDI objects, handles, and USER objects, providing full stack traces and direct navigation to source code. Users praise its accuracy and ease of use.
JetBrains dotMemory
Specializing in .NET applications, dotMemory provides detailed memory usage analysis. It helps identify why objects remain in memory, what consumes the most memory, and how garbage collection affects performance. Unlike traditional leak detectors, it works with managed code environments.
Windows Performance Monitor (PerfMon)
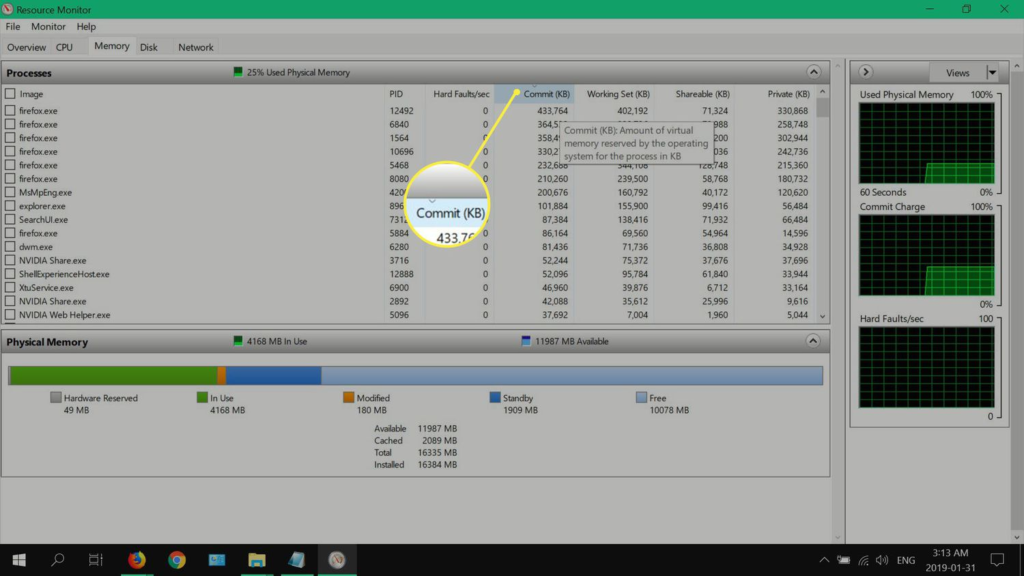
For system-wide monitoring, PerfMon provides built-in Windows performance monitoring. By tracking counters like Pool Paged Bytes and Pool Nonpaged Bytes over time, you can identify memory trends and potential leaks. While PerfMon doesn’t pinpoint the source of a leak, it’s valuable for initial detection.
Modern Development Tools
Contemporary development environments often include integrated memory profiling. Visual Studio’s Diagnostic Tools, for example, provides real-time memory analysis and memory snapshots for managed and native code. These tools have largely replaced the need for standalone utilities like Windows Leaks Detector for many developers.
When to Use Windows Leaks Detector
Despite the availability of more modern tools, Windows Leaks Detector remains relevant in certain scenarios:
- Legacy Systems: For older Windows applications that haven’t been updated, Windows Leaks Detector may be the only compatible solution.
- Minimal Resource Requirements: At only a few hundred kilobytes, the tool has minimal overhead and can be run on older or resource-constrained systems.
- Quick Investigations: Its simple interface makes it suitable for quick preliminary investigations when you don’t want to set up a full profiling environment.
- Third-Party Applications: When you don’t have source code access, its ability to attach to any running process is valuable.
Best Practices for Memory Leak Detection
Systematic Approach
Effective leak detection requires a methodical approach. Start by confirming a leak exists using system-level monitoring tools like PerfMon. Then, use specialized tools to isolate the specific leak source. Running the application through multiple cycles and taking memory snapshots at each stage helps narrow down the problem area.
Reproducing the Leak
For effective detection, you need to reliably reproduce the leak. This might mean running specific test cases, exercising particular code paths, or simulating production workloads. Without reproducibility, even the best detection tools will be ineffective.
Analyzing Call Stacks
When a tool provides call stack information, use it to identify the allocation path. Look for functions that allocate memory without corresponding free operations. Pay special attention to error handling paths and edge cases that might be overlooked during normal development.
Continuous Monitoring
Modern development practices often incorporate regular memory analysis. Rather than only investigating problems, proactive use of memory profiling tools during development can catch leaks before they reach production. This approach is particularly recommended for long-running applications or services.
Conclusion
Windows Leaks Detector represents an important piece of software development history, offering early developers a straightforward way to identify memory leaks in Windows applications. Its innovative approach to detecting cyclic memory leaks without requiring source code access made it a valuable tool in its time.
While more modern solutions now dominate the memory leak detection landscape, understanding tools like Windows Leaks Detector provides insight into fundamental concepts of memory management and leak detection. The tool’s core principles—API hooking, call stack analysis, and time-based monitoring—continue to inform how memory leak detection works today.
For developers working with older Windows systems or seeking a lightweight, open-source solution, Windows Leaks Detector may still serve a purpose. However, for most modern development scenarios, the integrated tools in contemporary IDEs or specialized solutions like Deleaker, dotMemory, or UMDH will likely provide more comprehensive and user-friendly experiences.
Frequently Asked Questions
What is a memory leak and why is it a problem?
A memory leak occurs when a program allocates memory but fails to release it back to the operating system when no longer needed. This causes the application’s memory usage to gradually increase over time. For long-running applications like servers or system services, even small leaks can eventually degrade performance, cause system slowdowns, or lead to application crashes. Windows Leaks Detector is designed to identify these leaks in Windows applications.
How does Windows Leaks Detector work without source code?
Windows Leaks Detector uses a technique called API hooking to intercept calls to Windows memory management functions like HeapAlloc and HeapFree. It attaches to any running Windows process and monitors these system-level calls. This means it can detect memory leaks regardless of the programming language used and doesn’t require access to the application’s source code.
What are the main limitations of Windows Leaks Detector?
The tool’s primary limitations include: monitoring only HeapAlloc, HeapRealloc, and HeapFree functions rather than all memory operations; inability to monitor multiple processes simultaneously; and compatibility primarily with older Windows versions like XP and Windows 2000. Users have also reported some usability issues and challenges with process attachment.
What tools can I use instead of Windows Leaks Detector?
Modern alternatives include Deleaker, which offers Visual Studio integration and detection of memory, GDI, and handle leaks; JetBrains dotMemory for .NET applications; Microsoft’s UMDH included in Debugging Tools for Windows; and Windows Performance Monitor for system-wide monitoring. Many contemporary IDEs also include built-in memory profiling tools.
Can Windows Leaks Detector work with modern Windows versions?
The tool was originally designed for Windows XP and earlier versions. While it may run on newer Windows systems, it hasn’t been updated for modern compatibility. For current Windows versions (Windows 10 and 11), professional developers generally recommend using more recent tools like Deleaker or integrated IDE profiling features that provide better functionality and support.