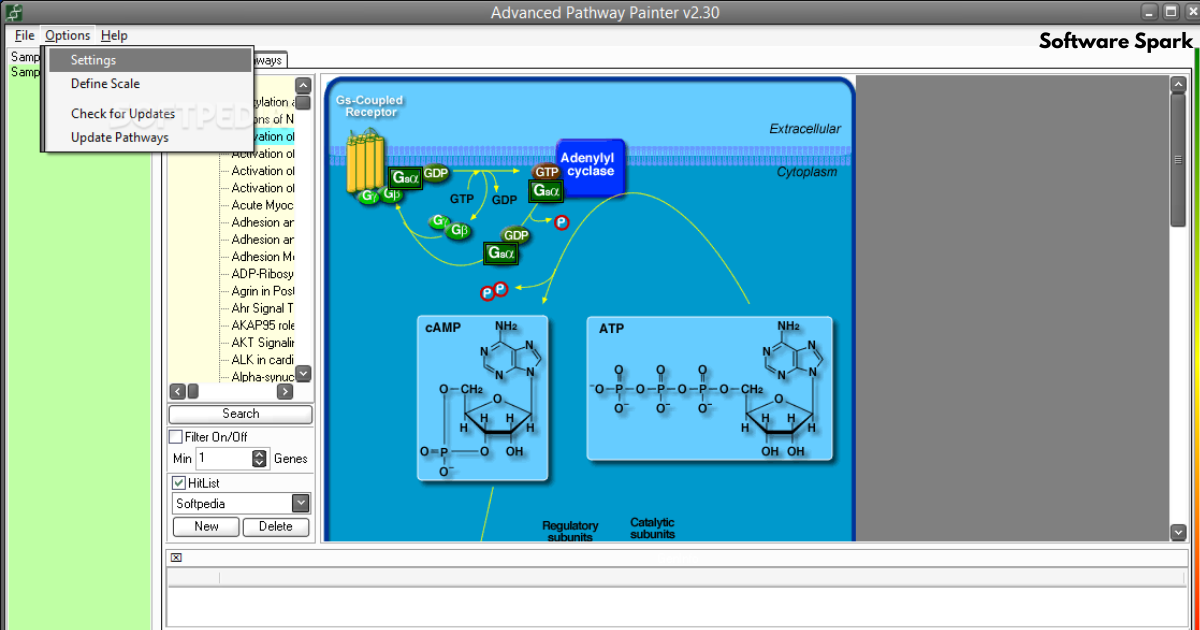
GSA Advanced Pathway Painter – The Essential Biological Pathway Visualization
In the field of bioinformatics, understanding the complex networks of interactions within a cell is fundamental to modern biological research. Biological pathways—the intricate series of molecular interactions that drive cellular processes—are at the heart of this understanding. However, the data generated from gene and protein experiments can be overwhelming. The GSA Advanced Pathway Painter is a free software tool designed to bridge the gap between raw experimental data and visual biological insight. This guide explores the capabilities, applications, and significance of this tool for researchers, educators, and students in the biosciences.
Understanding Biological Pathways and the Need for Visualization
Biological pathways describe the molecular interactions that occur within a cell, from metabolic reactions to signaling cascades that regulate gene expression. They are essential for understanding how cells function and how disruptions in these pathways can lead to disease.
What Are Biological Pathways?
A biological pathway is a series of interactions among molecules within a cell that leads to a specific product or change. They can be broadly categorized into:
- Metabolic Pathways: These involve a series of chemical reactions catalyzed by enzymes, where the product of one reaction becomes the substrate for the next (e.g., glycolysis, the citric acid cycle).
- Signaling Pathways: These involve the transmission of signals from outside the cell to its interior, leading to changes in gene expression or cellular behavior (e.g., the MAPK/ERK pathway).
- Gene Regulatory Pathways: These involve interactions between proteins (like transcription factors) and DNA that regulate gene expression.
The Data Visualization Challenge
Modern biological research, particularly in the post-genomic era, produces vast amounts of quantitative data. Techniques like microarrays, RNA-Seq, and proteomics generate enormous datasets that are difficult to interpret in a spreadsheet . The challenge is to map this data onto our understanding of biological networks to identify which pathways are active, altered, or disrupted in a given condition.
This is where pathway visualization tools become indispensable. They allow researchers to overlay experimental data onto known pathway diagrams, revealing patterns that would be impossible to see in raw data .
What is the GSA Advanced Pathway Painter?
The GSA Advanced Pathway Painter is a free software application developed by GSA (Softwareentwicklung und Analytik GmbH) for the Windows operating system . It provides a user-friendly interface for visualizing biological pathways and overlaying quantitative data from gene and protein experiments directly onto these pathway diagrams .
Freeware Accessibility
One of the most significant aspects of this tool is that it is available as freeware . This makes it highly accessible to academic researchers, students, and educators who may not have the budget for expensive commercial software. Its broad availability has contributed to its popularity in teaching and research environments .
Longevity and Compatibility
The Advanced Pathway Painter has been available for many years, with its development spanning different eras of Windows operating systems. It is compatible with a very wide range of Windows versions, from legacy systems like Windows 95 and 98 to modern iterations like Windows 10 and 11, and even Windows Server versions . This broad compatibility ensures that it can be used on older lab computers as well as newer machines.
Key Features and Capabilities
The Advanced Pathway Painter is equipped with a specific set of features tailored to the needs of biological researchers.
1. Visualization of Major Pathway Databases
The software comes pre-loaded with or provides access to pathways from several of the most important and widely used biological pathway databases, including:
- KEGG (Kyoto Encyclopedia of Genes and Genomes): A comprehensive resource for understanding high-level functions and utilities of biological systems.
- BioCarta: A database of classic biological pathways with rich annotations.
- GenMAPP: A database and software package designed for visualizing and analyzing gene expression data on biological pathways .
2. Overlaying Quantitative Data
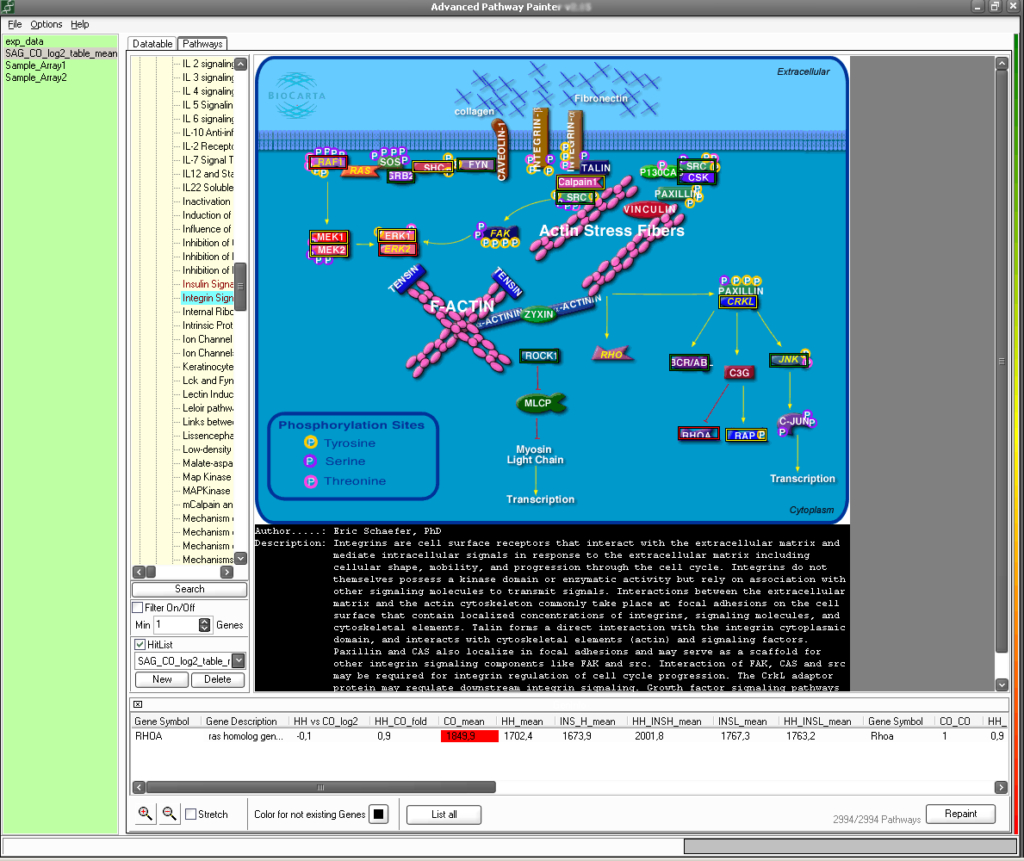
The core functionality of the tool is its ability to display quantitative data from gene and protein experiments directly within the pathways . This is achieved through a color-coding system, where different colors represent different values or expression levels . For instance, a researcher could color-code each gene or protein in a pathway based on its level of expression in diseased tissue versus healthy tissue, instantly revealing which parts of the pathway are up- or down-regulated.
3. Linking and Web Integration
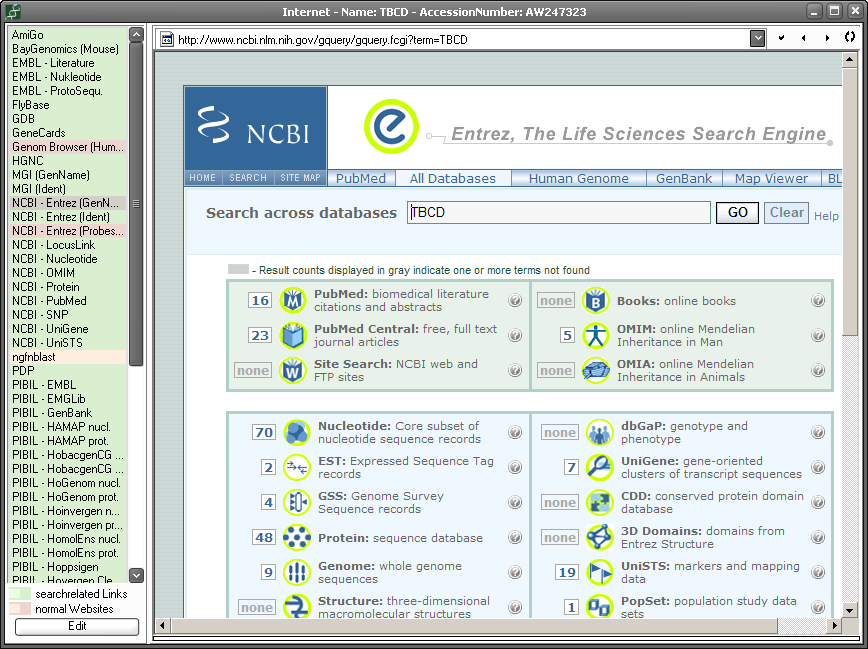
A key feature is the linking between pathway items (genes or proteins) and experimental data. This connection is established using gene or protein names and their accession numbers . Furthermore, the tool provides a web interface with direct links to major external databases . This feature allows researchers to quickly access a wealth of additional information about a specific gene or protein. The integrated links include:
- NCBI Databases: OMIM (Online Mendelian Inheritance in Man), Protein, PubMed, SNP, UniGene, and UniSTS .
- Other Databases: PBIL, CloneReport, GeneReport .
4. Search Functionality
The tool includes powerful search capabilities, allowing users to find pathways or specific genes/proteins by their name or accession number . This is essential for navigating large pathway databases efficiently.
5. Broad Organism Support
The application includes pathways not just for humans but for a wide variety of plants and animals as well . This makes it a versatile tool for researchers studying diverse model organisms.
Practical Applications and Use Cases
The GSA Advanced Pathway Painter finds utility in several key areas.
For Bioinformatics and Genomics Research
- Analyzing Gene Expression Data: A researcher with a list of differentially expressed genes from a microarray or RNA-Seq experiment can use the tool to visualize where these genes lie within various pathways. This can help identify key biological processes affected by a disease or treatment.
- Identifying Pathways of Interest: By overlaying data onto pathways, researchers can quickly see which pathways are most significantly affected. Color-coded maps of active pathways can serve as powerful visual evidence for a paper or presentation.
For Education and Teaching
The visual nature of the tool makes it an excellent teaching aid. Students can see the relationship between individual genes and their roles in larger cellular processes. The interactive elements, such as links to databases, encourage deeper exploration and research skills.
For Hypothesis Generation
By visually inspecting which parts of a pathway are affected, researchers can generate new hypotheses about the underlying biology. For example, if a particular branch of a signaling pathway is consistently upregulated, it might suggest that this branch is a key driver of the phenotype being studied.
How to Use the Advanced Pathway Painter
While the specific steps may vary with different versions, the general workflow is straightforward.
Step 1: Installation and Launch
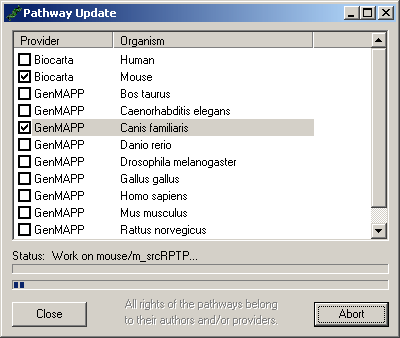
The program comes with an installer, making the setup process simple . Once installed, launching the application presents the user with a compact interface .
Step 2: Selecting a Pathway
Users can choose from the pre-loaded pathways from databases like KEGG or GenMAPP. The search function can be used to locate a specific pathway by name (e.g., “Glycolysis”) or by a specific gene or protein of interest.
Step 3: Importing Experimental Data
The user can import their quantitative experimental data. The data should be organized to be linkable to pathway items via gene/protein names or accession numbers .
Step 4: Visualizing the Data
Once the data is linked, the software will color-code the pathway elements according to the values provided. The user can adjust the color settings to differentiate values and parameters . The result is a visual representation of the experiment’s results mapped onto the biological pathway.
Step 5: Exploring and Exporting
Users can click on pathway elements to access the web interface and quickly gather more information from external databases. The finalized image can be captured or exported for use in reports, presentations, and publications.
Frequently Asked Questions (FAQs)
1. What is GSA Advanced Pathway Painter used for?
GSA Advanced Pathway Painter is a free Windows tool used by bioscience researchers and students to visualize biological pathways. Its primary function is to display quantitative data from gene and protein experiments directly onto pathway diagrams (from KEGG, GenMAPP, etc.) using a color-coding system to represent different values .
2. What operating systems does it support?
The tool boasts extensive compatibility, supporting a very wide range of Windows versions. This includes legacy systems like Windows 95/98/ME/NT/2000/XP as well as Windows Vista, 7, 8, 10, 11, and various Windows Server editions .
3. Is the software really free to use?
Yes, the GSA Advanced Pathway Painter is released as freeware . This makes it a highly accessible tool for academic research, educational purposes, and individual use.
4. What are the main features of this program?
Key features include visualization of pathways from major databases like KEGG and BioCarta, the ability to map quantitative data onto pathways using color coding, and a web interface with direct links to external databases such as NCBI, OMIM, and PubMed for quick reference .
5. Who is this software designed for?
The application is designed for students, educators, and researchers in the biosciences. It is particularly useful for analyzing and visualizing data from gene and protein expression experiments, helping to identify pathways that are altered in diseases or in response to treatments .
Conclusion
The GSA Advanced Pathway Painter is a testament to the power of accessible, well-designed scientific software. It provides a vital bridge between the abstract world of biological data and the visual understanding of cellular processes. Its capability to overlay quantitative experimental data onto standard pathway diagrams transforms raw numbers into biological insight. This function is crucial for researchers analyzing complex datasets from genomics and proteomics experiments, helping them to identify key pathways involved in health and disease. The fact that it is offered as freeware with wide Windows compatibility has made it a valuable resource in classrooms and laboratories worldwide. While newer and more complex tools like PathVisio and PathWhiz have emerged, the Advanced Pathway Painter remains a testament to the fundamental importance of visualizing biology in the digital age .